Fuzzy Graphing
Here is both a conventional graph and a "Fuzzy graph" of the equation, \( y = x^2 \):
(Note that you can click on any graph in this article to open it.)
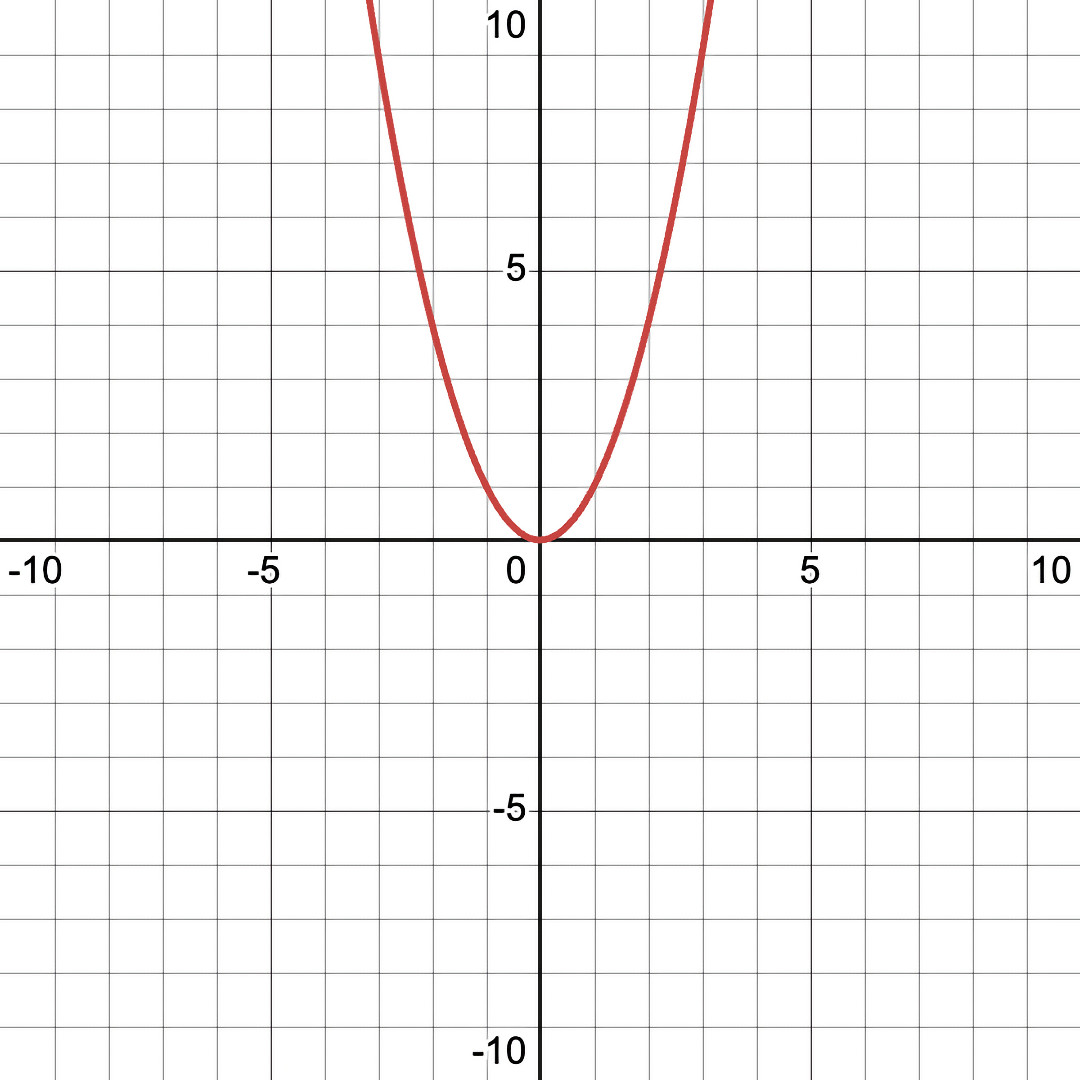
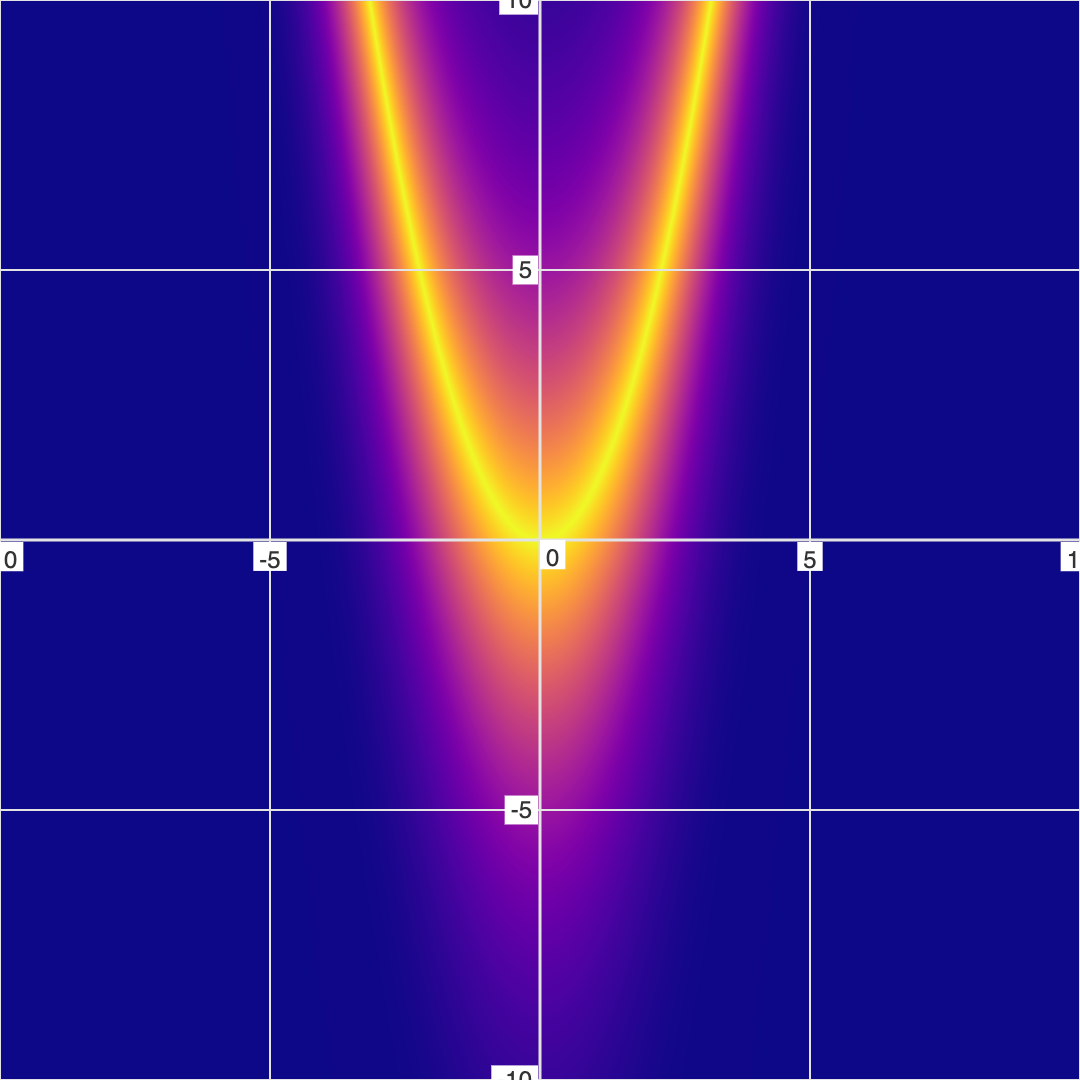
As you can see, the Fuzzy Graph version is more fuzzy than the conventional graph ("fuzzy" being the technical word - a reference to Fuzzy Logic). The fuzzy halo represents areas of the graph where the equation is nearly true (but not exactly true).
Instead of asking the same True/False question that conventional graphing apps evaluate ("Is the equation EXACTLY true at this point?"), FuzzyGraph calculates the error of the equation for each (x, y) point on the graph, and then maps the error to colors. This results in pretty gradients of color instead of solid lines on a white background.
Just a pretty face?
But is this any different than just doing a blur effect on the graph? Do fuzzy graphs reveal anything new compared to conventional/binary graphs?
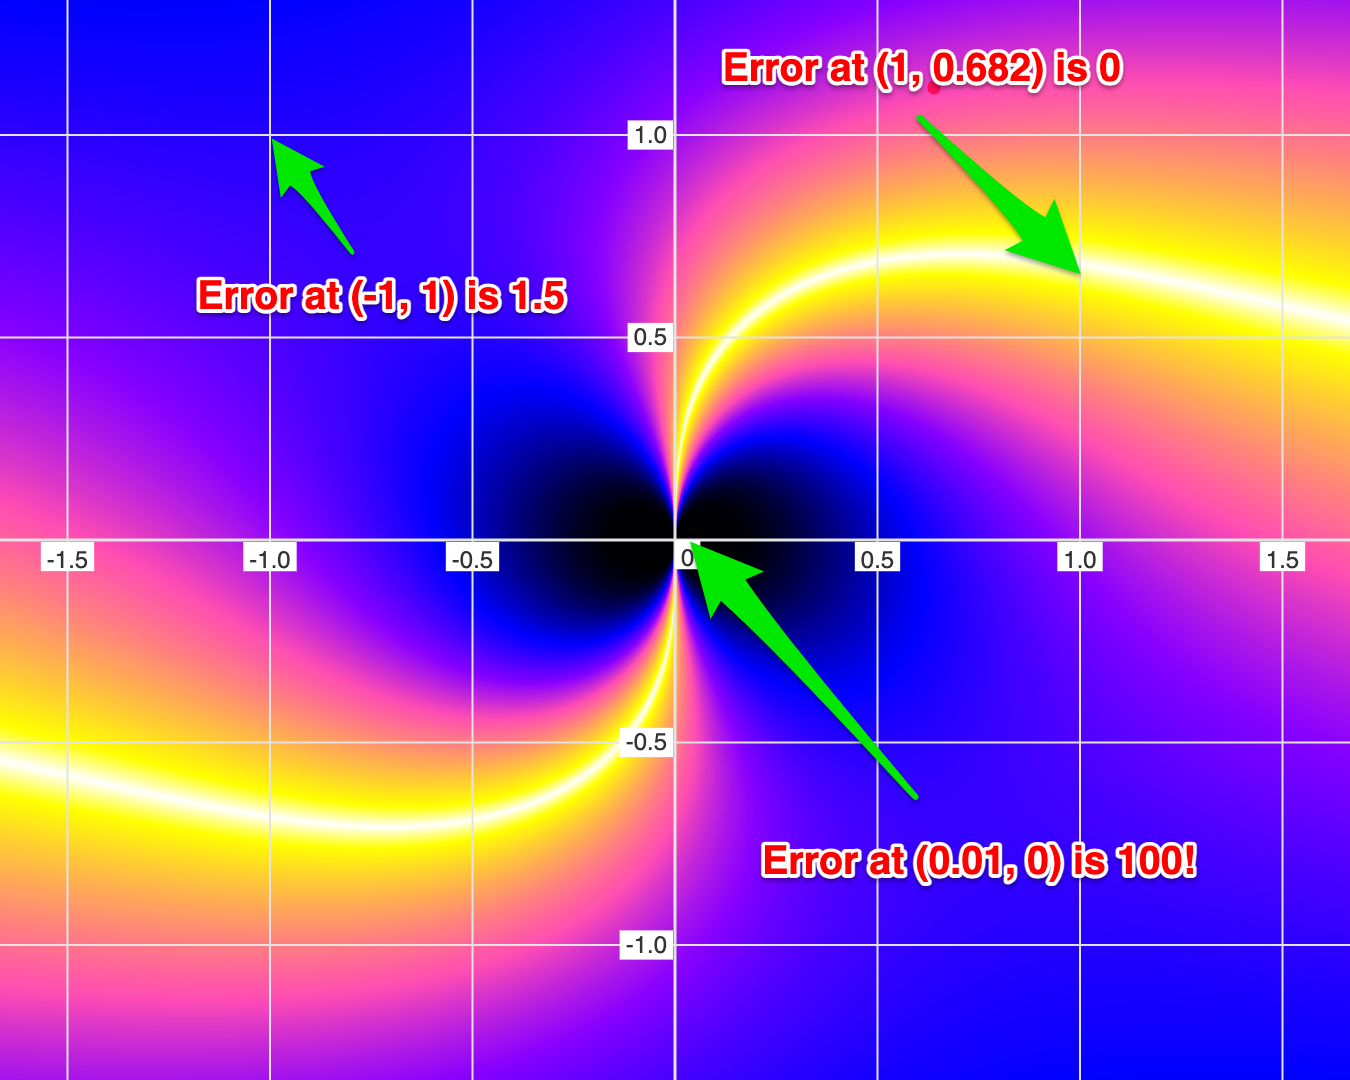
Let's look at another example: \(y = \frac{x}{x^2 + y^2} \)
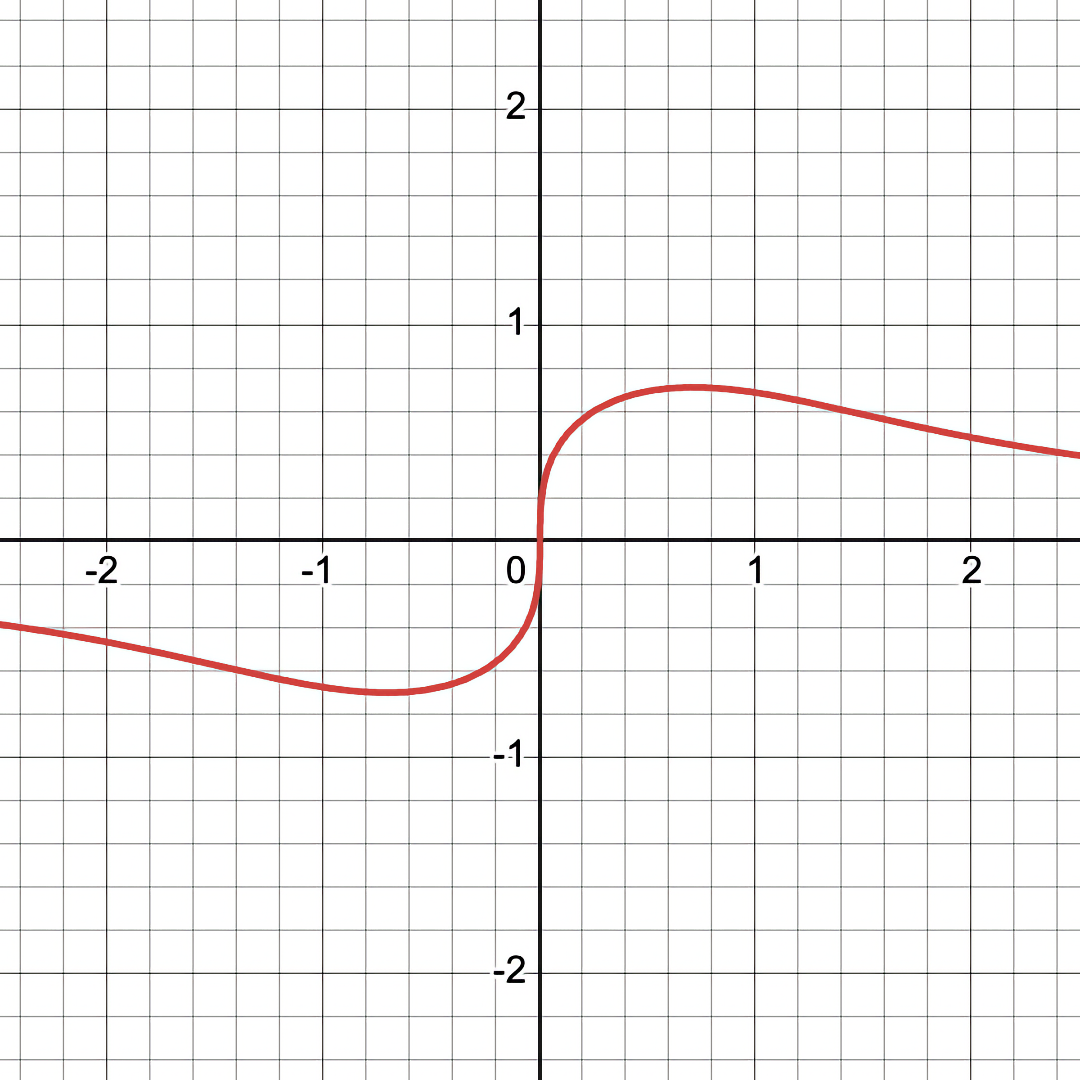
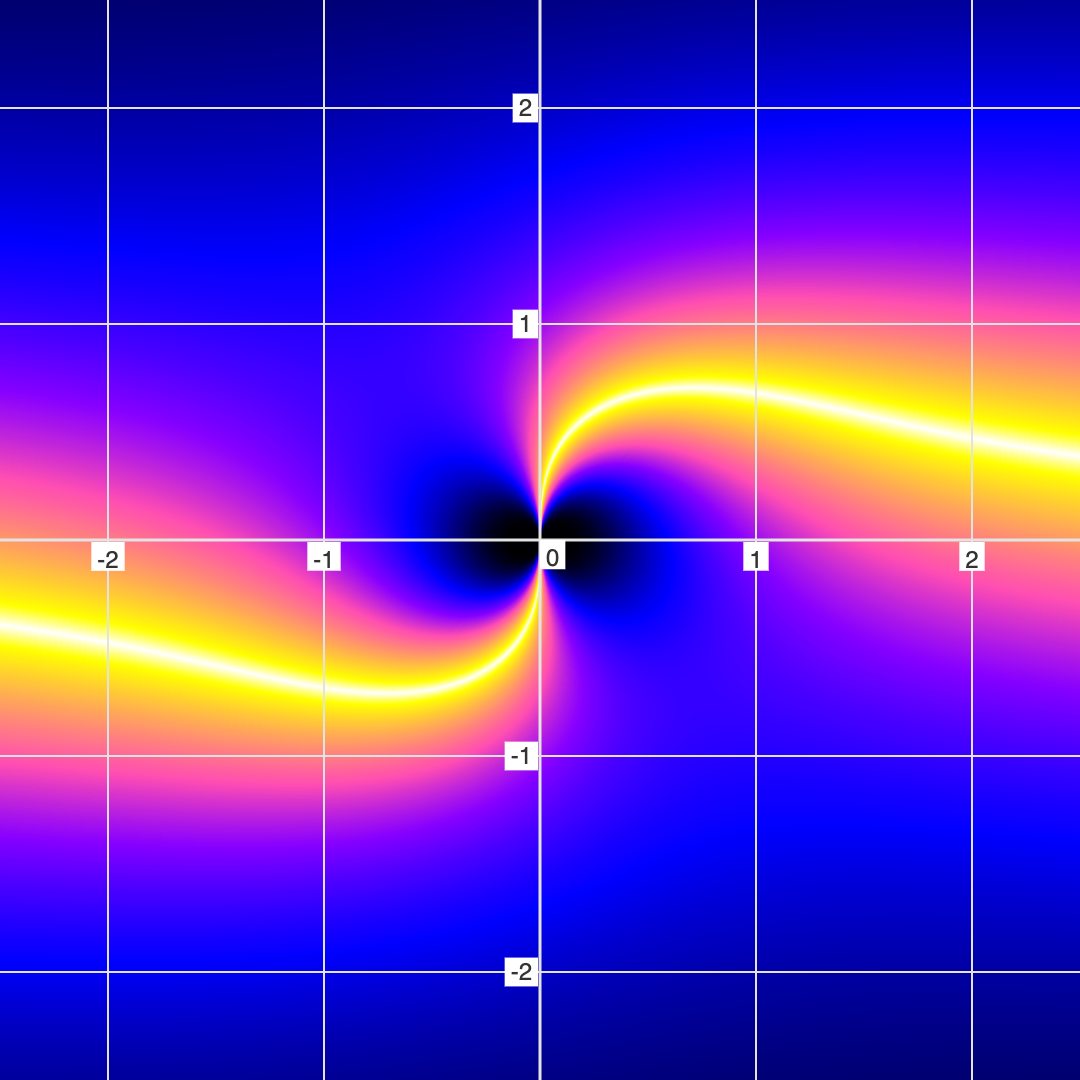
Notice that the black hole eye-looking features are COMPLETELY INVISIBLE in the conventional/binary mode of graphing.
These black hole eye-looking features are actually infinitely deep holes (asymptotes) that represent regions of high error. In fact, in FuzzyGraph (the world's first Fuzzy/Non-Binary Graphing app), you can move your mouse over the graph to view the error (note that this only works on desktops, since mobile devices don't have a mouse).
Underwater Islands
So in the case of "Quasar Equation" above (as I like to call it), Fuzzy Graphing reveal the hidden details of an area of high error. But Fuzzy graphing can also reveal areas of low (but not zero) error.
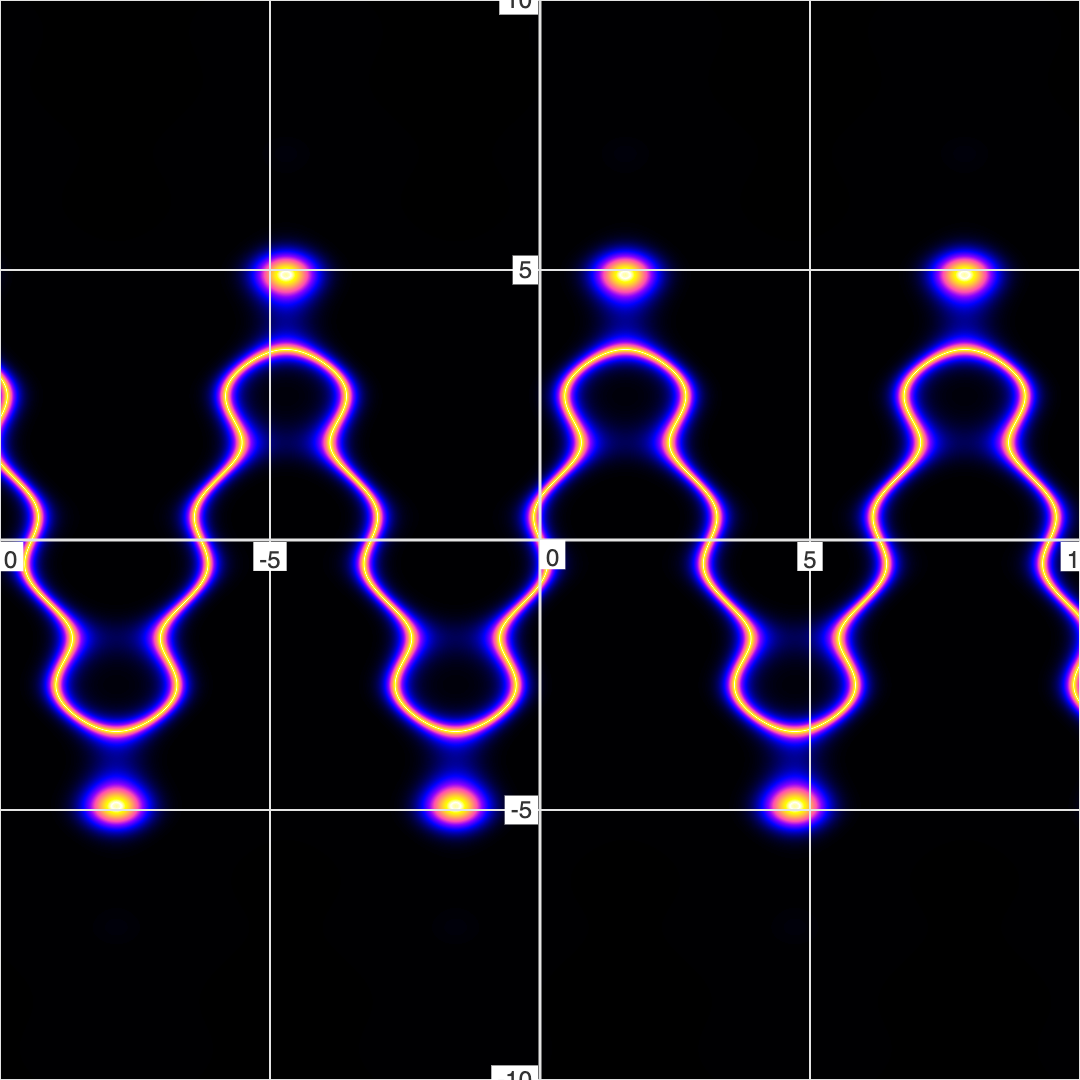
Consider the equation, \( y=4 sin(x)+ sin(2.7y) \), as both a conventional graph and a fuzzy graph:
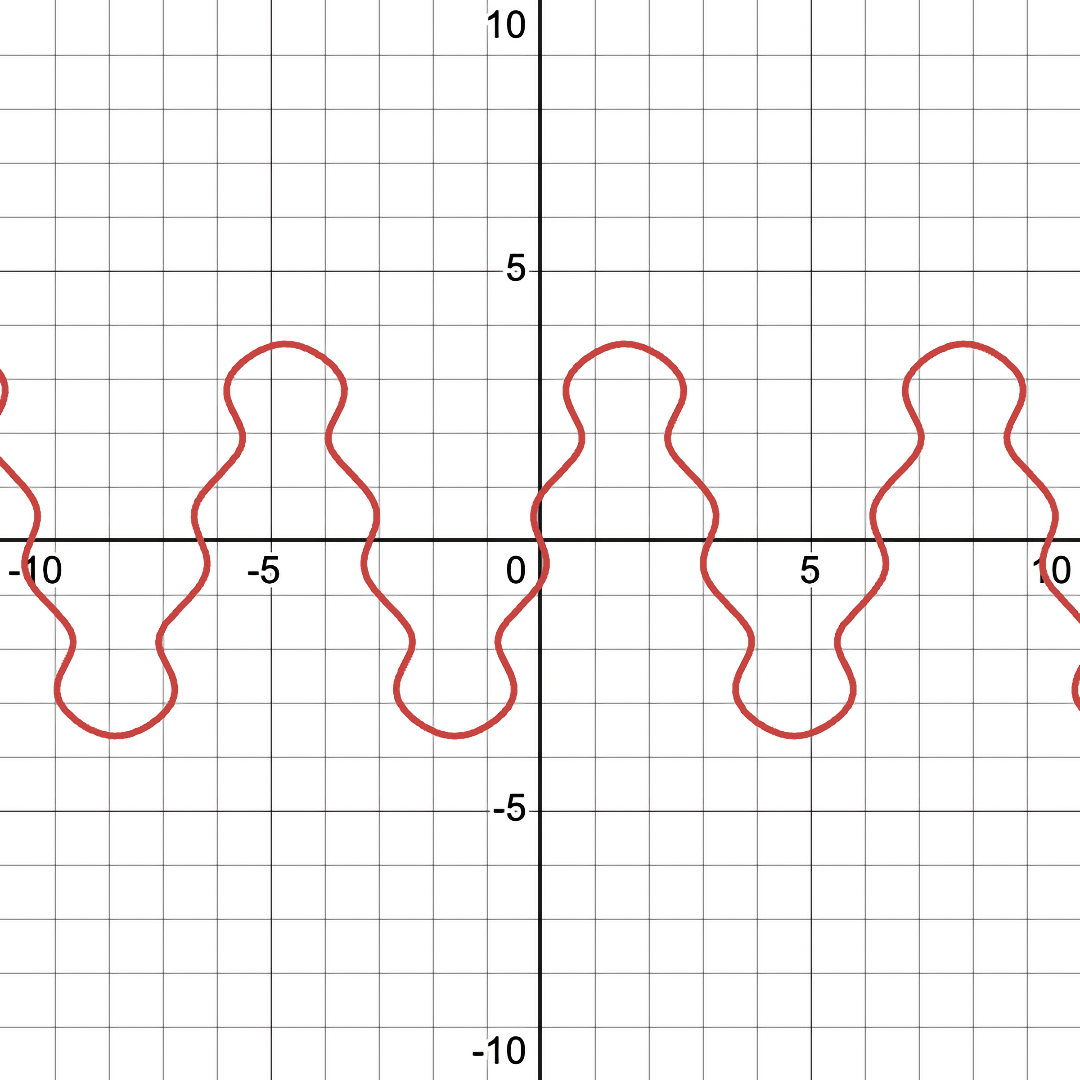
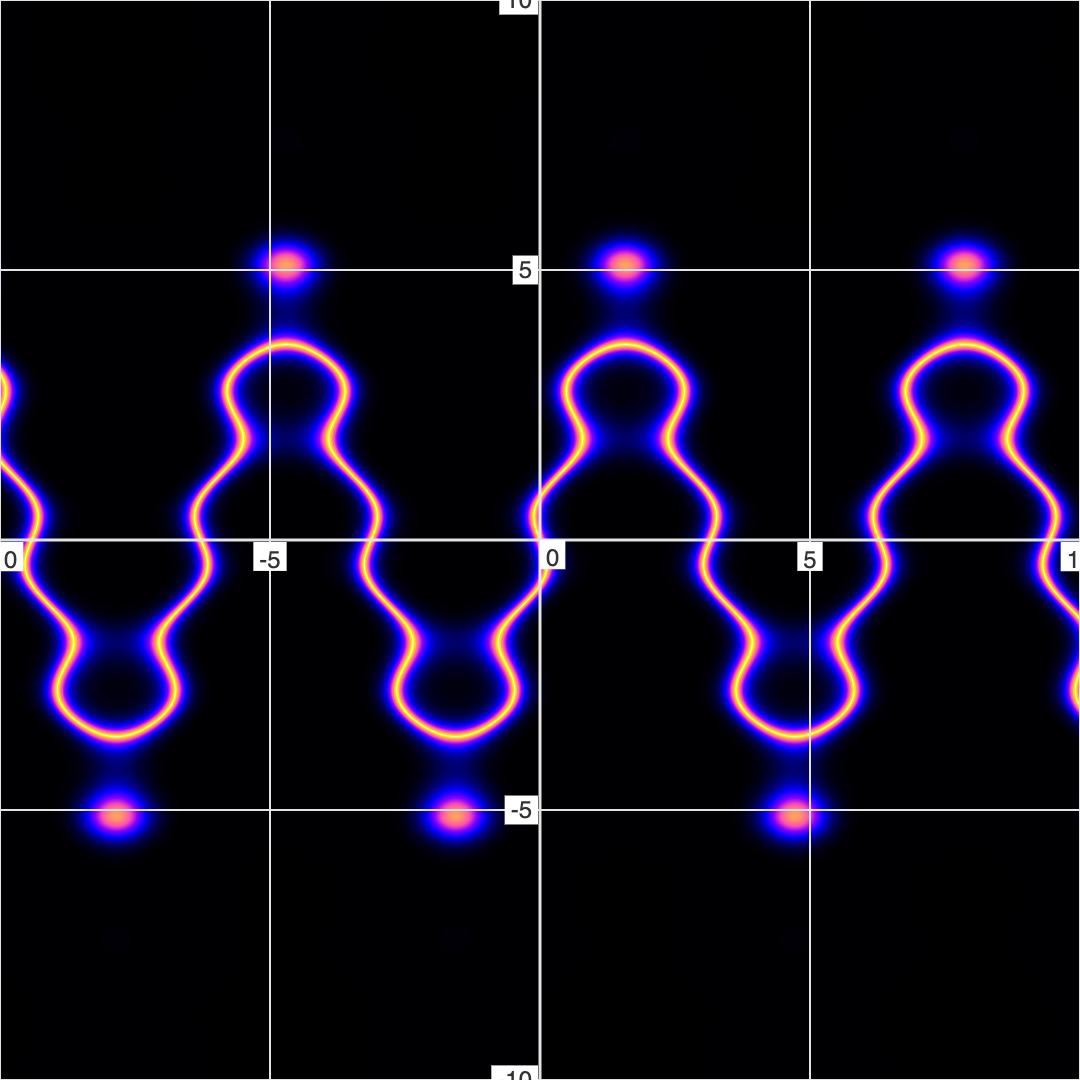
Note the floating dots in the fuzzy graph version that are not there in the conventional/binary graph. These are like underwater islands - underwater mountains that are just below the surface of the water (or in this case, the \( error == 0 \) surface). These hidden islands represent area that are near-solutions to the equation (which are only visible in FuzzyGraph).
Their presense hints that we can tweak the equation slightly to cause them to burst above the surface of the water (which should also make them visible in conventional graphs).
So let's change the equation from:
\( y=4 sin(x)+ sin(2.7y) \) to:
\( y=4 sin(x)+ sin(2.8y) \)...
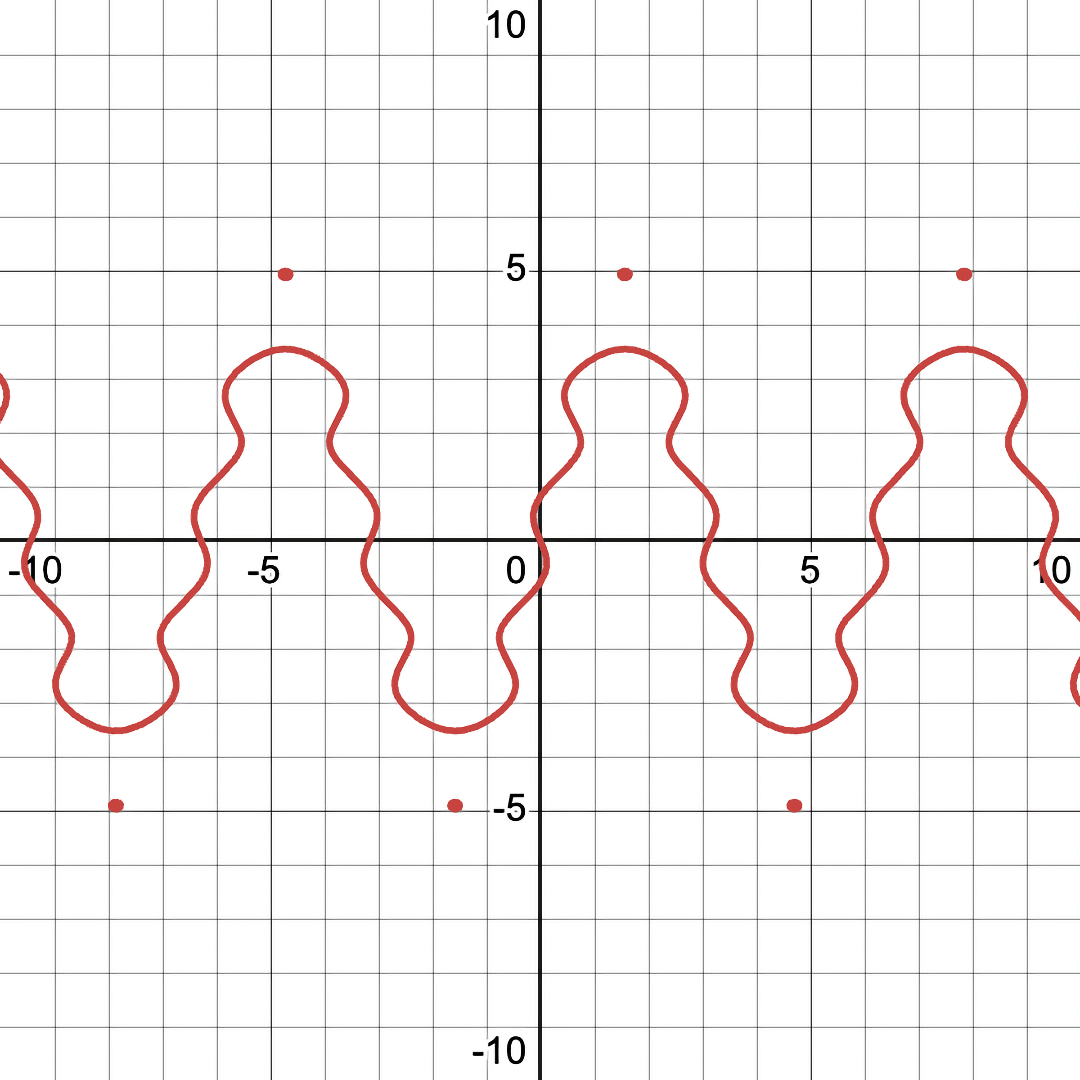
And as you can see, those previously-hidden islands are now visible in the conventional graph.
So Fuzzy/non-binary graphing can help us see features of the mathematical topography that are completely invisible with conventional/binary.
Mathematical Shadows
There are many hidden shadows lurking in the equations. One last example to look at is the equation: \( \frac{x}{x^2 + y^2 - 1} = 0 \):
As you can see, the mathematical shadows are not always hole-shaped. In this case, there is a shadow circle being cut by a light line.
Conclusion
Though Boolean/Binary logic is useful, it's not the only way to look at the world. Fuzzy graphing changes the question being asked from one with a boolean answer to one with a floating point answer. And this move from binary to non-binary reasoning reveals whole new dimensions of beauty and truth.
If you'd like to see more fuzzy graphs, check out this page.
And to play around with fuzzy graphing yourself, check out the FuzzyGraph App.
Date published: 2025-10-27